Every music director in every radio station around the world knows this one fundamental truth: picking songs and adjusting your playlist comes down to one thing – data!
I’m not just talking about music scores however (check out this piece from my good friend and colleague Mikkel about Song Deltas for a revolutionary take on music scores, that has delivered amazing results for our clients over the past 6 years) but so much more.
See how many of these are on your list for playlist meetings:
- What is the promotion plan from the record company like?
- How many other singles were already released from the album?
- Are they on tour?
- Are there TV/Online appearances planned?
- What is the online impact of the song? (check out our hybrid hitlist to answer this question)
- What does the airplay in other markets and at other stations look like?
Having worked for many happy years as a music director for several different radio formats, the last question was one that always ended up making a lot of work for my team and I, if we wanted to do it right. Whether or not you believe in national airplay charts, the reality is they don’t focus on the stations that are most relevant for you. For the reason that everything gets lumped together. We received a ridiculously large and time-consuming excel file every week. In order to be able to monitor those stations that were most relevant to our decision. It not only contained what they were playing, but how they were playing it and how it was developing for that specific set of stations.
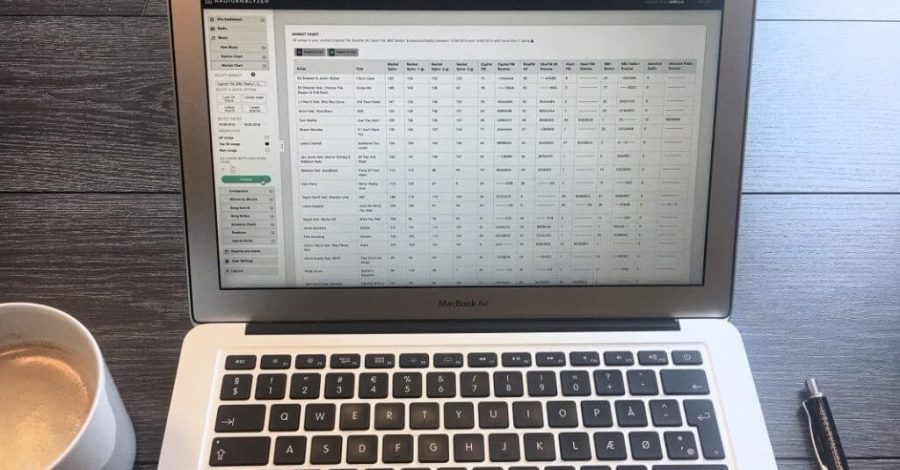
Taking a cue from our own radio experiences and a suggestion from a client, we created the Market Chart. The goal was to take all the work out of this process. With it, you can create your own individual markets. It enables you to get a precise and detail-rich read on the stations that matter the most to you.
RadioAnalyzer Market Chart will save you a lot of time
For example, here we created a Market for the city of London . It contains Capital FM, Kiss FM, Heart, BBC1 and Absolute.

For instance, on it, we can see not only which songs are most played just for this micro-market, but how they have developed overall in the past 3 week. Furthermore, we also include data on the individual station spins, and even show the song rotation on that station for the past 8 weeks!
Further, this doesn’t just apply to current music either. With the versatile search functions you can tailor your query. For example you can compare back rotations, look at re-currents, or just check out new adds from a specific time frame.
To sum up, check out the Market chart in action here:
How do you prepare for your playlist meetings? What can we do to help you make better decisions? I’d love to hear from you.
You can also reach out to our team. Furthermore, we are happy to answer all your questions.
Otherwise, please share this article if you found it interesting.

COO
You might say the poor guy never had a chance, being born to two radio-crazy ArmedForcesNetwork journalists that met in southeast Asia (think “Good Morning Vietnam” – and no, his dad is not Adrian Cronauer). Since discovering his love for music programming as a teenager, Bill has been obsessed with turning great ideas into numbers you can measure, and measured numbers into actionable programming strategies that make great radio. After touring Central Europe as a Music-Promotion-Programm- Director and a Research&Program Consultant for European and International Consulting firms, he has returned to the audio innovation trenches at RadioAnalyzer, and is loving every minute of it.


